In September, there was a sharp divergence across markets. The S&P 500 was virtually flat, while the Nasdaq advanced, supported by the large technology companies. In Europe, the STOXX 600 declined, while the MSCI ACWI posted a more moderate performance. Global fixed income was also under pressure as bond yields rose and markets expected interest rates to remain higher for longer.
- S&P 500: -0.45%
- Nasdaq: +3.23%
- Stoxx Europe: -2.49%
- MSCI All Country World Index (EUR): +1.95% (the dollar rose 2.50%, while the index fell 0.49% in USD).
- Global fixed income index (EUR): -0.17% (the dollar rose 2.50%, while the index fell 1.80% in USD).
The divergence in returns across indices is significant. The Nasdaq rose 3.23%, while the other indices were negative, with the exception of the ACWI due to the dollar. Gold fell 6.5%, oil rose 17%, the dollar gained 2.5% against the euro, and the yield on the 10-year U.S. Treasury rose from 4.75% to 5.28%.
What is driving this divergence?
If we set the Nasdaq aside, the market moves make a good deal of sense. Interest rates continued to rise, pressured by higher oil prices amid increasing geopolitical tensions and by concerns about deteriorating government deficits. This environment weighed on global equities, as reflected in the declines in the S&P 500 and, more sharply, the European STOXX 600. Europe also starts from two disadvantages: greater dependence on energy imports and less exposure to the technology and innovation sectors that are supporting much of the growth in the U.S. stock market.
Gold did not act as a safe-haven asset this time because real interest rates – that is, nominal rates adjusted for inflation – rose from 2.40% to 2.90%. This matters because gold generates no cash flow: it pays no interest, coupons, or dividends. Therefore, when real rates rise, the opportunity cost of holding gold increases relative to other alternatives. For example, a U.S. Treasury bond currently offers a real yield of close to 2.9% and, in principle, with a very low level of risk. Put simply, based on current data, that bond allows our money to grow by approximately 2.9% per year above inflation, making gold relatively less attractive.
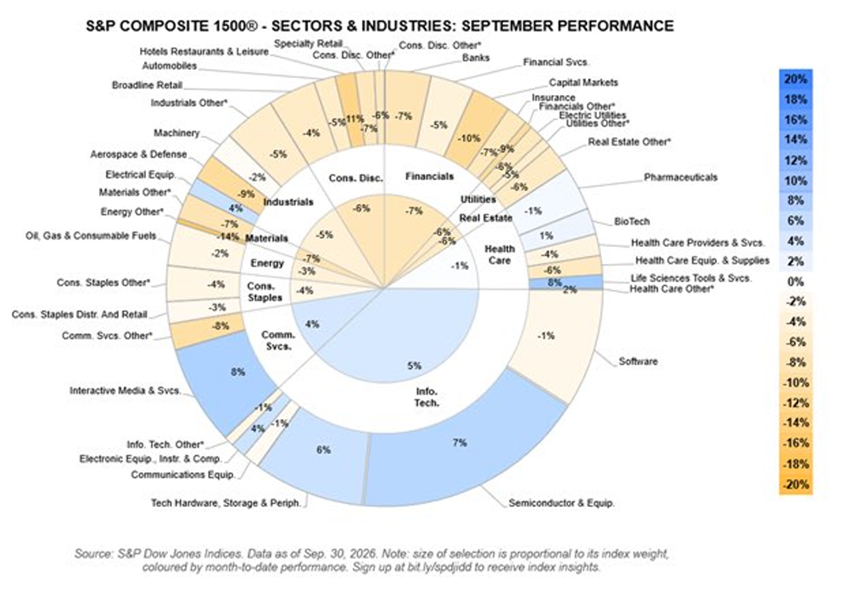
The U.S. market barely moved in aggregate terms during much of September, but beneath the surface most sectors and industries ended the month in negative territory. In other words, a reasonably resilient index concealed a market that was considerably less healthy than its headline level suggested.
The chart prepared by S&P Dow Jones Indices on the performance of the various sectors and industries in the S&P Composite 1500 during September is particularly revealing. Of the industries shown, only twelve ended the month in positive territory. However, those twelve industries represented more than 40% of the index’s market capitalization.
That explains much of what happened. The overall market could remain virtually flat while most of its components declined because a few large-cap areas – mainly related to technology, semiconductors, and certain communications segments – offset the weakness elsewhere.
And here an apparent contradiction emerges. We have often said that when interest rates rise, the companies that tend to suffer most are growth companies, and technology is probably the most representative sector among them. The reason is straightforward: much of their value depends on earnings expected in the future, and the higher interest rates are, the less those future earnings are worth today. So what is happening that allows the Nasdaq to continue outperforming the rest of the market when the vast majority of its constituent companies are growth companies?
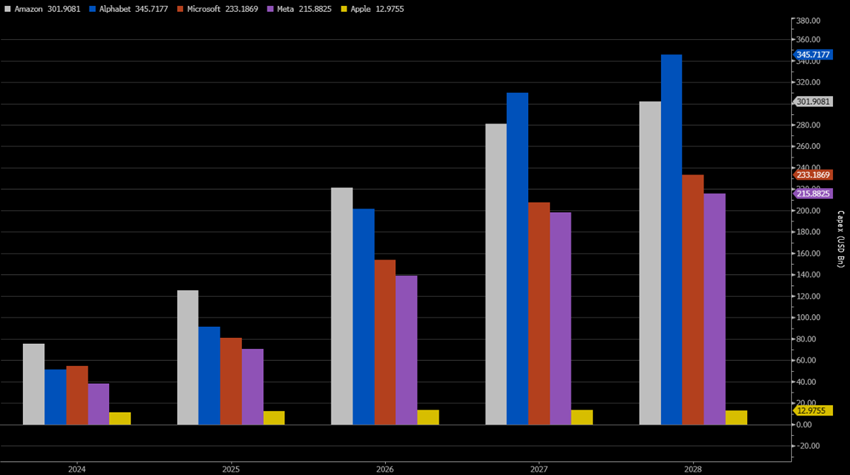
As noted earlier, the best-performing industries have been semiconductors and technology hardware, storage, and peripherals – precisely the areas benefiting most from the strong investment cycle tied to artificial intelligence. The image shows how the large companies – Amazon, Alphabet, Microsoft, Meta, and Apple – are increasing investment very significantly, much of it directed toward data centers, computing capacity, storage, and the technology infrastructure needed to develop and operate AI models.
Source: Bloomberg and own calculations
Investment is expected to reach $1 trillion in 2027 and $1.11 trillion in 2028.
To put the scale in perspective, the five large technology companies expect to invest approximately $1 trillion in total in 2027 alone. That amount is equivalent to more than half of everything Spain produces in a year and roughly twice the German federal government’s annual budget. This gives a sense of the scale of the investment cycle being driven by artificial intelligence.
The revenue growth expected in these industries is exceptionally high, and this is reflected in their stock-market performance, as shown in the following chart.
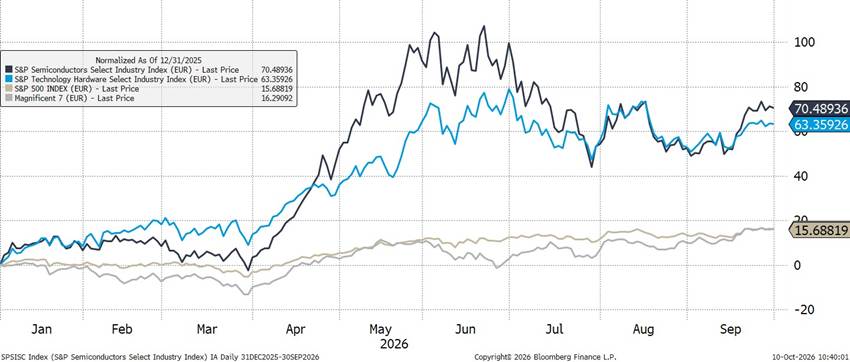
The beige line represents the S&P 500 and the gray line the well-known “Magnificent Seven” (M7). Both indices are showing positive performance, but the gains are being led by the companies benefiting most from the strong investment cycle of the M7 themselves.
It seems obvious: if these industries are the main beneficiaries of increased investment, the logical thing would be to invest in them. Right? Yes and no. In hindsight, everything looks much simpler than it really is.
The investment process requires answering several questions: which industries will truly benefit, whether it makes more sense to buy the index or select individual companies, the valuation at which we are investing, the investment horizon, and, finally, the additional volatility and risk we are adding to the portfolio.
To provide a reference point for current valuations – and simply to justify today’s prices – the average earnings growth of the companies in these indices would need to be very high: around 23% for the semiconductor index and 17% for the technology hardware, storage, and peripherals index over the coming years. In other words, a significant portion of future growth is already reflected in current valuations.
In addition, the following should be taken into account:
- Will the M7 maintain their pace of investment? As long as it remains profitable, that is fine.
- Many of these companies are mid- and small-cap companies, so we are taking on additional risk.
What stands out most to me is the poor performance of banks, which fell close to 6%. In theory, higher interest rates should benefit them because they increase net interest margins – the difference between what banks earn from lending money and what they pay for funding. In this case, however, two other factors are weighing more heavily. First, there is some pessimism regarding third-quarter results after Bank of America’s CEO warned on September 14, at a Barclays conference, that results could come in below expectations. Second, the rapid rise in rates in September does not reflect an improving economy, but rather the deterioration of public finances and an increase in inflation expectations. That kind of increase in rates tends to be less favorable for banks because it can slow credit growth, increase default risk, and put additional pressure on their balance sheets.
There is also a less obvious effect of higher rates. Many banks hold loans and other assets originated when rates were much lower, so those assets continue to generate relatively low returns. Their funding costs, however – deposits and debt – adjust more quickly to the new rates. If funding costs rise faster than the yield on those older loans, net interest margins can narrow. The Federal Reserve itself recently highlighted this risk, especially when banks have to replace low-cost deposits with more expensive funding.[1]
Is there an opportunity in fixed income?
Clearly, with higher interest rates, fixed income offers more attractive yields. But is all fixed income equally attractive? No. In this environment, careful selection is especially important, with a focus on issuers that have sufficient capacity to meet their payment obligations.
Many companies financed themselves a few years ago at rates close to zero, when borrowing was very cheap. The problem is that part of that debt will now have to be refinanced at much higher rates, increasing financing costs and potentially putting pressure on weaker companies. That is why, more than ever, it is not enough to look only at the yield a bond offers; we also need to analyze the issuer behind it and its actual ability to repay the debt.
We know that debt in the United States has increased very significantly, to the point that interest payments on public debt now exceed defense spending. However, if we put the figure in context and combine public and private debt, the total was equivalent to approximately 370% of GDP in the second quarter of 2026. That is unquestionably a very high figure, but it is virtually the same as twenty years ago – around 368% in 2006 – and still below the peak reached in 2008, close to 400% of GDP, as can be seen in the chart prepared by the Federal Reserve itself.
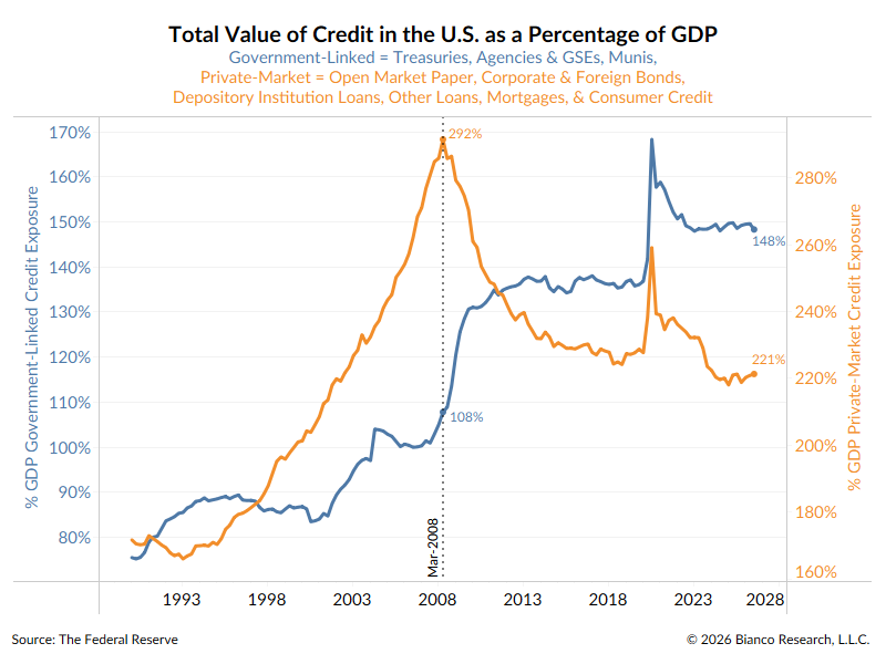
What really matters is how the composition of that debt has changed. Over these years, the private sector has undergone a significant deleveraging process, while public-sector debt has increased sharply. In other words, the total level of debt is not very different from what it was two decades ago, but today a much larger share is concentrated in the government sector.
Therefore, at the outset I am fairly comfortable selecting corporate fixed income from companies that have used these years to reduce leverage. Ultimately, the main risk when buying a corporate bond is that the company may be unable to meet its payments and end up defaulting.
But then another question arises: if companies have deleveraged and the government is borrowing so much, wouldn’t it be better to buy corporate bonds rather than government debt? Well, although I am not Galician, I will answer like one: it depends.
On the one hand, it is very difficult for the U.S. government to default on its debt. On the other, an important concept comes into play here: convexity. Here we go again with the financial jargon. I will try to explain it simply, because I admit it is one of those concepts that, from time to time, makes you go back to the fixed-income textbook gathering dust on the shelf.
We already know that duration measures how much a bond’s price changes when interest rates move: the higher the duration, the more sensitive the bond is to a rise or fall in rates. For example, if a 10-year U.S. Treasury bond has a duration of 8 and rates rise by one percentage point, its price would fall by approximately 8% (Duration x -change in rates); conversely, if rates fall by one percentage point, its price would rise by approximately 8%.
Convexity measures how the sensitivity of a bond’s price changes as interest rates move: it causes the bond to rise more than expected when rates fall and to decline less than expected when rates rise. Generally, the longer the maturity, the greater the convexity: the bond gains more than expected when rates fall and loses less than expected when rates rise.
In summary, duration provides an initial linear estimate of the impact of interest rates on price, while convexity captures the curvature of that relationship and corrects the estimate when the move in rates is large, as is happening today.
Using the previous example, the current convexity of the 10-year U.S. Treasury bond is 75. This convexity adds +0.375% to the estimate obtained using duration alone.[2]
Suppose we invest $100,000 in a bond with a modified duration of 8 and convexity of 75.
If rates rise by 1%
Duration-only estimate: an 8% loss, equivalent to -$8,000.
Estimate using duration and convexity: an 8% loss less the positive effect of convexity, or -7.625%, equivalent to -$7,625.
Therefore, convexity reduces the loss by $375.
If rates fall by 1%
Duration-only estimate: an 8% gain, equivalent to +$8,000.
Estimate using duration and convexity: an 8% gain plus the positive effect of convexity, or +8.375%, equivalent to +$8,375.
Therefore, convexity increases the gain by $375.
In a scenario of economic slowdown and moderating inflation, long-term bonds could offer an attractive opportunity: their greater duration and convexity would amplify price appreciation if rates fall and reduce the decline if rates rise. Nevertheless, they would still lose value if rates continued to rise.
Investing means living with uncertainty, and one of our main responsibilities as managers is to try to reduce it as much as possible. Is there an opportunity in long-term fixed income? In light of the points discussed above, we believe there is, and that it may be precisely a way to contain that uncertainty.
For more Market Reviews, click here.
[1] The Fed – Assessing Bank Resilience to a Funding Shock
[2] The approximate price change is calculated as: ΔP≈−D×Δy+ 1/2 ×C×(Δy)^2, where D is modified duration, C is convexity, and Δy is the change in yield expressed in decimal form.