
In August, the focus shifted from geopolitical tensions to monetary policy, inflation, and bond volatility, with stock markets holding up thanks to record earnings and artificial intelligence (AI). Fixed income, by contrast, was the worst-performing asset class, particularly in the long-term government bond segment.
- S&P 500: +2.62%
- Nasdaq: +4.18%
- Stoxx Europe: +0.29%
- MSCI All Country World Index (EUR): +2.42% (the dollar fell -0.79%; the index in USD rose 2.56%).
- Global Fixed-Income Index (EUR): -0.50% (the dollar fell by -0.79%, the index in USD fell by -0.01%).
What’s going on with fixed-income securities?
Fixed income, particularly long-term bonds, posted significant declines during the month. The increase in debt supply, widening government deficits, rising energy prices, and greater uncertainty surrounding inflation and interest rates drove up the term-premium [1] demanded by investors. As a result, bond yields rose—most sharply for long-term maturities—and bond prices fell. Let’s elaborate on this explanation a bit further.
Gold rose by +9.67%, in line with the strong performance of the markets. Although its correlation with equities is usually low, it can increase during certain periods, such as the current one. Possible reasons include the following:
- There is fear in the markets
- Real interest rates are low or negative
- There is abundant liquidity
- The currency is weakening
- Inflation expectations are rising
As we have noted in previous comments, rising debt and widening fiscal deficits can contribute to currency depreciation. In practice, this amounts to a rise in prices: when the euro or the dollar lose value, they can purchase fewer goods and services.
Consequently, three of the aforementioned circumstances may currently be unfolding: greater liquidity, weakening currencies, and rising inflation expectations.
A significant portion of the market believes that a return of inflation to levels close to 2% may not occur quickly or easily. In fact, some investors are considering the possibility that, over the next few years, inflation will remain above the levels recorded in previous decades.
The possible causes of rising prices are as follows:
- Increased demand for goods and services, provided that supply remains constant.
This increased demand may reflect an improvement in economic activity. If it is supported by an increase in real income, productivity, or voluntary savings, the rise in prices could be interpreted—albeit with some caveats—as a healthy adjustment in relative prices. On the other hand, if it is primarily the result of artificial monetary or credit expansion, it may create imbalances and prove unsustainable.
- Rising production costs.
Rising costs for energy, raw materials, wages, or imported goods can be passed on to final prices. In this case, inflation would not necessarily reflect increased demand, but rather a reduction in available supply or a deterioration in production conditions.
- Shortages or supply issues.
Price increases can also be caused by shortages or supply-side issues, such as disruptions in supply chains, a lack of raw materials, logistical difficulties, natural disasters, or production constraints. In this case, prices rise not because demand is necessarily stronger, but because the quantity of available goods decreases.
- Increased debt, for example, to increase the government deficit.
A persistent government deficit can put upward pressure on prices, especially when it is financed through money creation or credit expansion that increases nominal demand faster than the supply of goods and services.
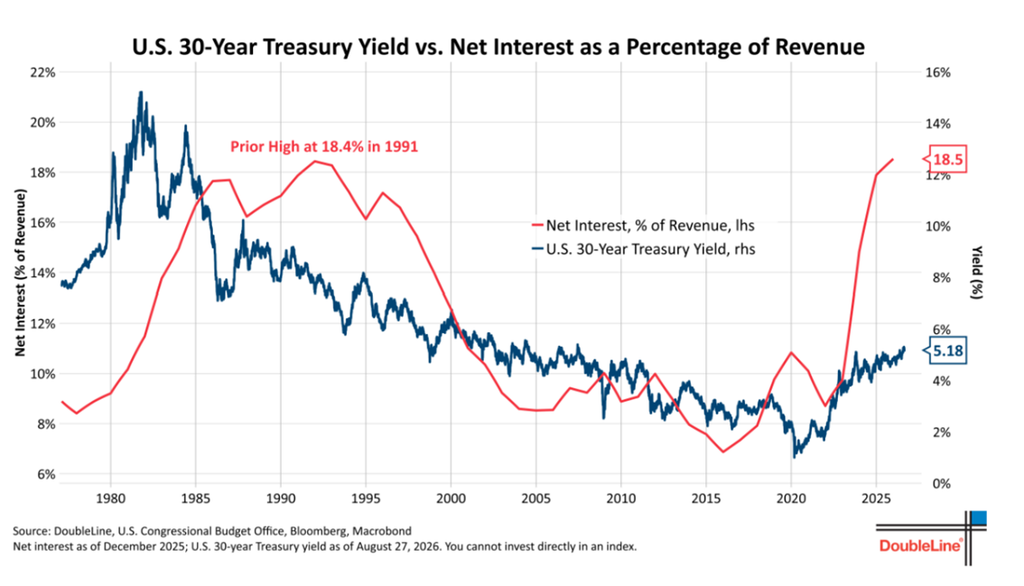
Most countries are widening their budget deficits and accumulating higher levels of debt. The following chart from the investment firm Doubleline shows the trend in interest payments as a percentage of government revenue in the United States. This indicator has just surpassed the record high of 18.4% set in 1991 and is now at historically high levels.
Source: Doubleline
If you look closely, the previous peak of 18.4% was reached when interest rates were around 8%, whereas today they barely exceed 5%. According to the Doubleline report[2], although rates are currently lower, the U.S. government’s debt burden is much higher. Therefore, the fact that the cost of debt is reaching levels similar to those of 1991—despite lower rates—makes the yield on the 30-year bond particularly sensitive.
We must not forget that the private sector—and more specifically, the artificial intelligence sector—is projected to have capital expenditures of $760 billion this yearAs a result, it will have to compete with the government for available funding, which could drive up its financing costs.
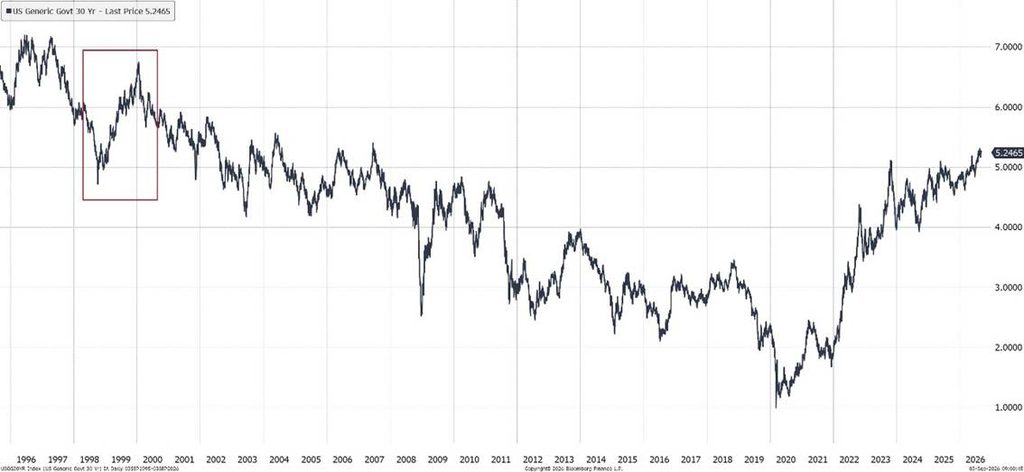
This phenomenon bears some resemblance to what happened in the years leading up to the dot-com crisis, around the year 2000, when the euphoria generated by the emergence of the internet drove heavy investment in the technology sector, while many companies financed their expansion with the expectation of a very promising future. IThe chart shows, within the red box, the rise in the yield on the 30-year bond[3] rose in the years leading up to the crisis.
Source: Bloomberg and self-created
Shortly thereafter, the dot-com bubble burst, triggering a severe economic crisis. As the economic cycle deteriorated, the Federal Reserve significantly lowered interest rates in an effort to stimulate the economy. At the same time, expectations of slower growth and more contained inflation, along with the search for safe-haven assets, drove demand for government debt and pushed bond yields lower, including those on the 30-year U.S. Treasury bond.
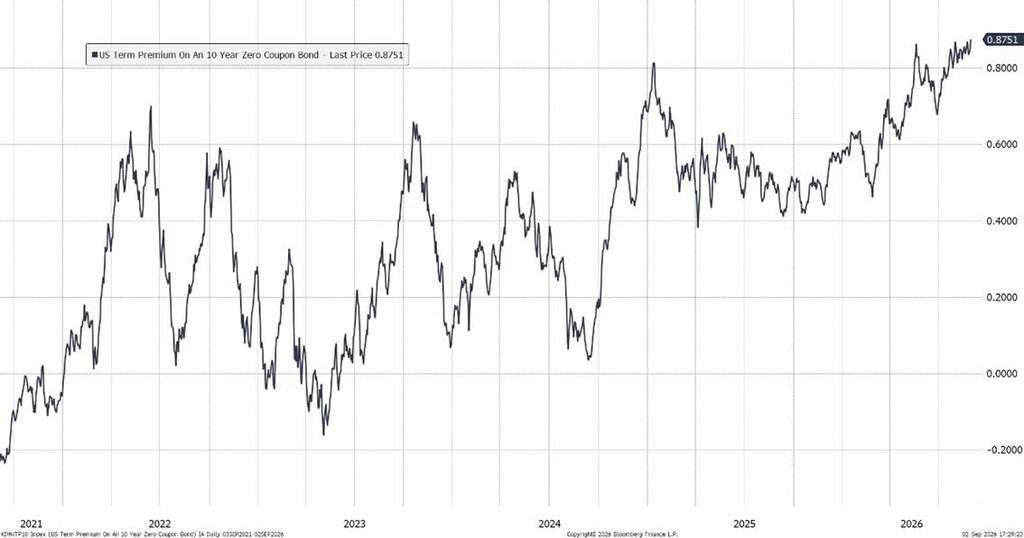
What indicators can we use to gauge the level of investor concern? As we mentioned earlier, one of them is the term premium. The following chart shows the evolution of this premium, which has followed an upward trajectory throughout 2026.
Source: Bloomberg and sef-created
It is important to remember that the term premium reflects investors’ perceptions of future trends in interest rates, inflation, and economic conditions. A rise in the term premium indicates greater uncertainty, which investors price in by demanding higher yields[4] on both long-term government and corporate bonds.
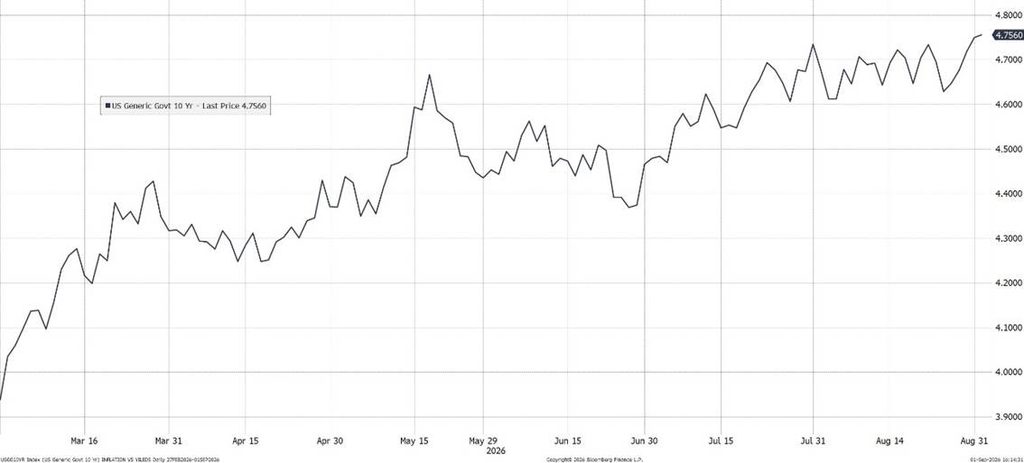
The following chart shows the rise in the yield on the 10-year U.S. Treasury bond, one of the key benchmarks for fixed-income markets worldwide.
Source: Bloomberg and self-created
The rise in this yield has implications for long-term interest rates as a whole. When the yield on the 10-year U.S. Treasury bond rises, the market tends to adjust the required yields on other fixed-income assets as well, including corporate bonds.
In this context, one might ask whether current yield levels present an opportunity to add long-term bonds to a portfolio and aim for yields above 5%.
To provide a theoretical reference, we can use the earnings yield gap model, which is the difference between the S&P’s earnings yield and the bond yield[5] .
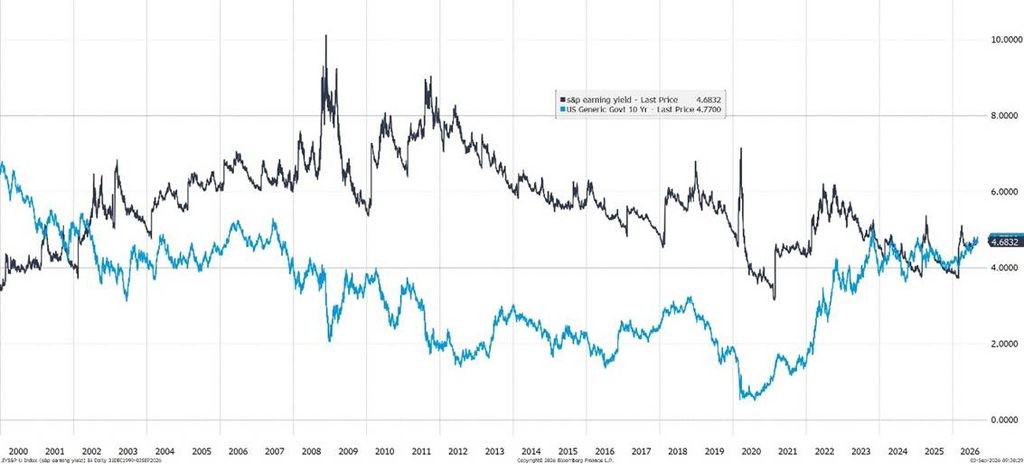
Source: Bloomberg and self-created
The EYG is a benchmark used by some portfolio managers to assess the relative attractiveness of equities versus fixed income within an asset allocation strategy. When the spread narrows, the additional return offered by the stock market relative to the risk-free asset also decreases.
For much of the past two decades, equities have offered a higher earnings yield than long-term sovereign bonds. However, this spread has narrowed significantly in the United States; the S&P 500’s earnings yield is now very close to—and even slightly below—the yield on the 10-year U.S. Treasury bond.
In this context, the indicator’s performance in the United States supports the case for gradually reducing exposure to equities and increasing the weight of fixed income. If the earnings yield of the U.S. stock market stands at around 4.7% and the 10-year Treasury bond offers a yield close to 4.8%, investors can achieve a similar return in government bonds, with less uncertainty regarding earnings generation and lower sensitivity to potential downward revisions in corporate expectations. This comparison does not imply that equities should be abandoned, but it does suggest that their relative appeal has weakened.
Europe presents a different picture. The earnings yield gap between the STOXX Europe 600 and the 10-year German government bond remains around 3.8% in favor of equities. This largely reflects the valuation difference between the two markets: the U.S. stock market trades at a higher P/E ratio, associated with higher earnings growth expectations—particularly in the technology and growth sectors—whereas European equities trade at lower multiples and, therefore, offer a higher earnings yield. The positive European spread suggests that the European stock market retains a significant valuation premium relative to German debt, although it also incorporates structurally more moderate earnings growth prospects and a different sectoral composition.
Therefore, the earnings yield gap should be interpreted as a relative valuation benchmark, not as an isolated buy or sell signal. Its interpretation must be supplemented by earnings growth expectations, inflation trends, portfolio duration, the stance of monetary policy, the risk premium demanded for equities, and so on.
Furthermore, we cannot rule out a scenario in which inflation picks up again, forcing central banks to keep interest rates high for longer—or even to tighten monetary policy once more. In that case, bond yields could continue to rise, putting additional pressure on fixed-income prices, particularly for bonds with longer durations.
For this reason, a prudent strategy would be to gradually increase exposure to fixed income, avoiding concentrating purchases at a single point in time and diversifying the portfolio’s duration. The current improvement in yields makes it possible to build a fixed-income portfolio with higher yields to maturity than we have seen in recent years, but uncertainty regarding inflation and interest rates suggests a phased approach. In fixed income, patience is also part of the return; it is not so much about getting the exact entry point right as it is about gradually building a position capable of withstanding various macroeconomic scenarios.
For more Market Reviews: Click here.
[1] Term Premium: It is the additional compensation that investors demand for committing their capital over a long period and assuming the uncertainty associated with future changes in interest rates, inflation, and economic conditions.
[2] Federal Interest Burden Exceeds 1991 High With 30-Year Yields at Only 5% – DoubleLine
[3] When many companies compete for financing, the demand for credit increases. As a result, investors demand a higher rate of return in exchange for lending them money.
[4] Bonds are sold, and their yield rises.
[5] The earnings yield is measured as the inverse of the P/E ratio (in this case, the estimated 12-month P/E ratio). The estimated P/E ratio is 21.35x, so the inverse is 4.68. For the yield, we use that of the 10-year U.S. Treasury bond, which is 4.76%. Any other bond can be used, as this one is risk-free and is typically taken as the opportunity cost.