I am writing this letter on December 26 so that you will have it available in early January, as I will be away with my family until January 6 on a mission called Mary’s Children in Ngong, near Nairobi.
For this reason, the data you will see below corresponds to the close of the markets on December 24.
- S&P 500: +1.21%
- Nasdaq: +0.87%
- Stoxx Europe: +2.13%
- MSCI All Country World Index (EUR): +0.18% (the dollar fell 1.57%, while the index in USD rose 1.68%).
- Global fixed income index (EUR): -1.13% (the dollar also fell 1.57%, so the index in USD fell 0.42%).
Overall, it has not been a month of high volatility, but there has been some uncertainty surrounding interest rates and how this situation could affect the field of artificial intelligence. As I mentioned last month, there are reasonable doubts about how to finance the expected heavy investment and how to cope with the increase in energy demand associated with this sector.
Although market performance over the last month has been relatively stable, this uncertainty has led to episodes of volatility throughout the year, especially in the artificial intelligence sector. This can be clearly seen in the following chart of an ETF (investment vehicle) that groups together US companies linked to this type of business.
At first glance, the annual data is very attractive: so far this year, the ETF has accumulated a return of 32%. However, this final result hides an important reality: during February and March, it suffered a drop of close to 26%.
And here the key question arises: Would we have been able to maintain the investment during that drop without selling?
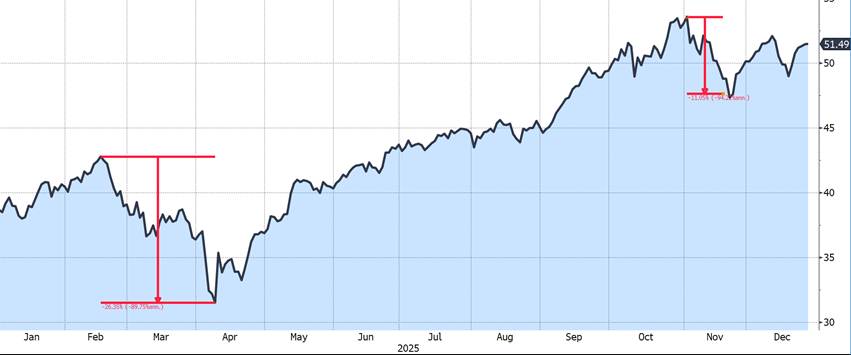
Source: Bloomberg
If you have carried out your analysis and the conclusion is positive, the reasonable thing to do would be to maintain your investment and even increase it if you are highly confident. But it’s not that simple, is it?
Doubts begin to creep in: was the analysis sufficient, should you have listened to the criticism, is this time different… I don’t know about you, but this happens to me ALL THE TIME.
One of the characteristics that a good manager should have is to have gone through difficult times, as experience helps to better understand how financial markets really work. And you don’t have to be particularly brilliant to understand this; in fact, the opposite example is very illustrative.
The hedge fund Long Term Capital Management, founded in 1994 by John Meriwether (formerly of Salomon Brothers), had such brilliant minds as Myron Scholes and Robert Merton, winners of the 1997 Nobel Prize in Economics. Despite this, the fund ended up going bankrupt after taking on excessive debt, convinced that its strategy could not fail.
It’s not about being very intelligent, but about applying common sense and dedicating a lot of time to studying. It’s true that sometimes the best investments can be boring (personally, they’re the ones I like best), but if we’re convinced of them, we have to persevere even when the going gets tough. I firmly believe that artificial intelligence is here to stay, but it’s not my style to invest in companies with very high multiples, in other words, companies that I consider too expensive.
All this reminds me of a series of charts shared by Jordi García, from Dinero y Bolsa[1], which I found particularly interesting and illustrative. I think they help us to think long term and forget about the “magic” of the short term.
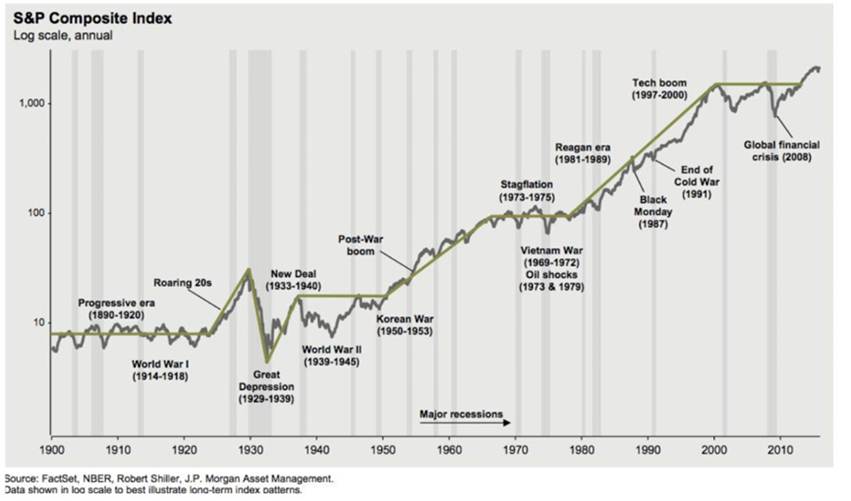
Invest for the long term, for real.
The S&P 500, despite having gone through some of the most difficult times in recent history—the Great Depression, world wars, and major financial bubbles—has generated an annual return of over 9%.
Even if we limit ourselves to the 21st century, the index has achieved an annual return of 8.13%, despite the dot-com bubble, the real estate crisis, and the COVID pandemic.
The investor’s worst enemy is…the investor himself.
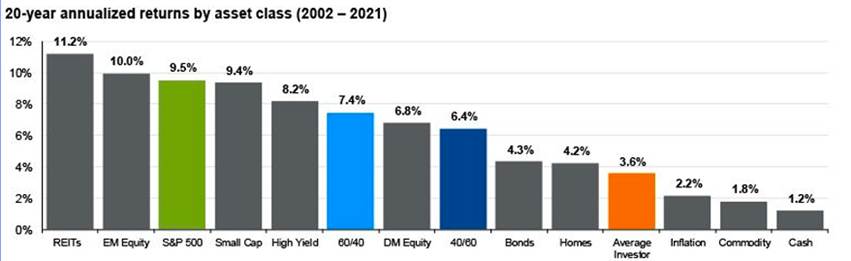
Source: JP Morgan
Over the past 20 years, investing in stocks has generated an annual return of 9.5%, while fixed income has offered 4.3%. However, the average investor barely achieved an annual return of 3.6%.
Peter Lynch, manager of the Magellan Fund for 13 years (1977–1990), achieved a compound annual return of 29%. Even so, according to studies by Fidelity, the average investor in the fund earned returns of between 7% and 10%, even below the market.
The reason? Our emotional biases push us to buy and sell at the worst possible time.
Can we predict the future?
We can study and analyze how the economy and financial markets work, and use that to establish benchmarks. But we will NEVER know for sure what will happen in the future.
This somewhat peculiar graph shows precisely how wrong Wall Street economists are when predicting interest rate trends. The dotted lines represent forecasts and the solid line represents reality. Spoiler alert: they don’t get a single one right.
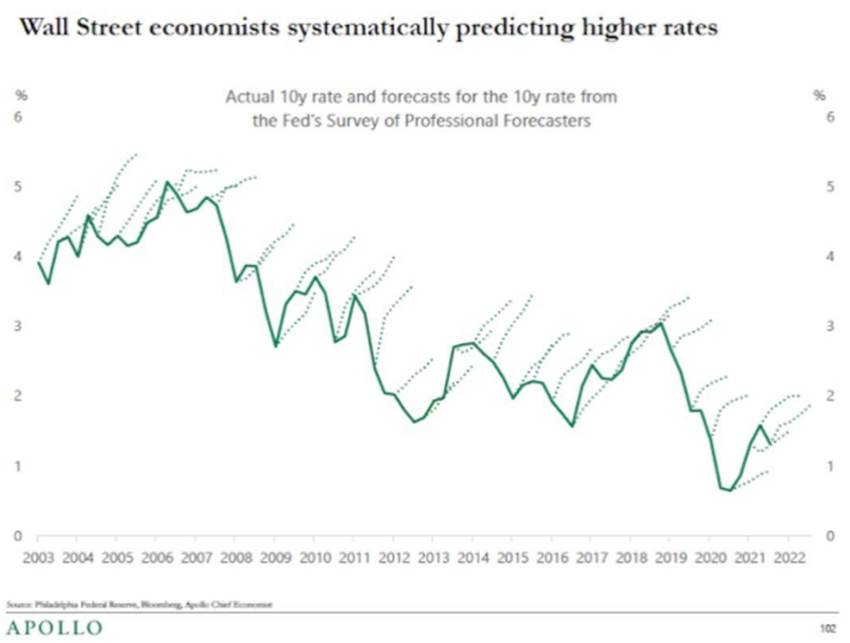
It was said that economists were paid twice: once for making predictions and again for explaining why they had not come true. Mind you, there are excellent economists, but that does not make them fortune tellers.
The actions and benefits
Long-term stock performance correlates with company profits. Put simply, over time, companies that earn more money tend to be worth more on the stock market.
In the short term, however, market movements respond to other, very different factors: speculation, fads, trends, cash flows, and expectations, all of which are difficult to predict.
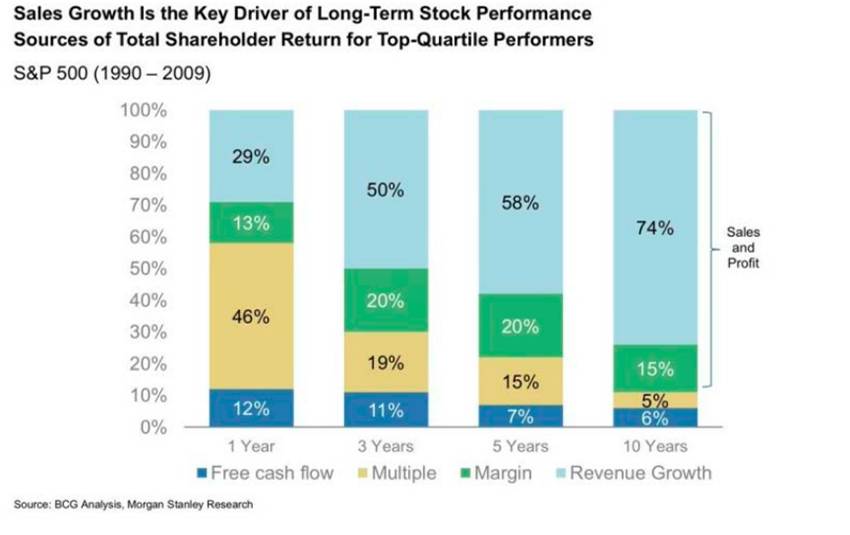
This graph clearly shows this difference. Over a one-year horizon, stock market performance depends largely on the expansion of the multiple, i.e., on expectations about the future, which may or may not be fulfilled.
The problem is that these expectations must materialize. If they do not translate into higher sales and real profits, the subsequent adjustment can be catastrophic.
Ten years down the line, however, the determining factor in performance changes completely: what really explains the evolution of stocks is the sales and profits of companies, as it should be.
No, the stock market is not a casino… unless you decide to treat it as such. In that case, I can only wish you luck.
No gain, no pain
To obtain a reasonable return on long-term savings, it is inevitable to live with market volatility. There are no shortcuts. That’s right… sorry…
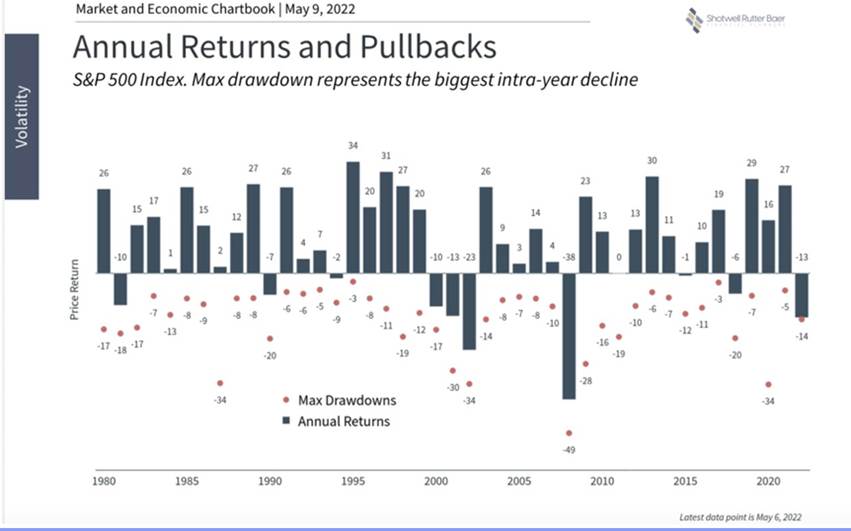
Source: Shotwell Rutter Baer
The blue bars on the chart show how the market ended each year. For example, in 1980, the S&P 500 closed the year with a 26% gain. However, the red dot indicates the biggest drop the market suffered during that same year, which was -17%.
Looking back, it all seems simple. But at the time, you have to live through and endure that -17%, without knowing yet that the year will end up being very positive. And this happens practically every year: even in those that end with strong gains, the intermediate declines can be significant.
The longer the investment period, the greater the probability of obtaining a positive annual return.
This chart is particularly interesting because it shows something fundamental: market declines are not necessarily a problem if we maintain our investment over the long term.
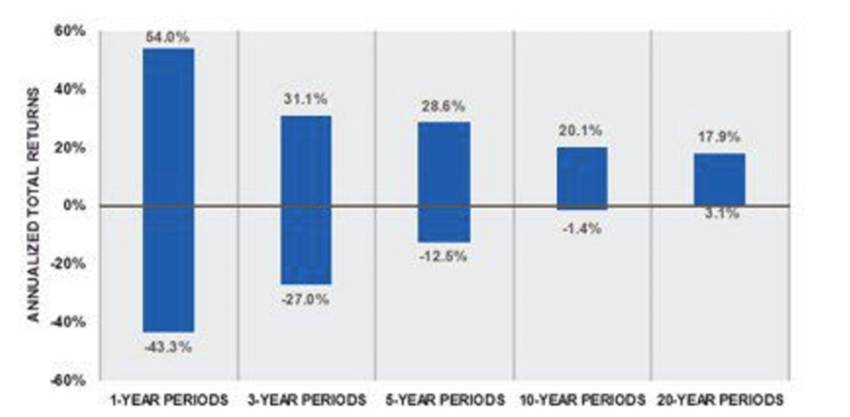
Source: ScwabCenter
If we invest for just one year, the result can vary greatly. The range of results goes from a gain of +54% to a loss of -43%. In other words, in the short term, practically anything can happen.
However, when we extend the time horizon and maintain the investment for 20 years, the picture changes radically. In that case, the range of results narrows significantly, falling between +17.9% and +3.1% per year.
In other words, time does not eliminate volatility, but it does drastically reduce the probability of negative results. And for an investor with long-term goals, that changes everything.
The conclusion is simple, or at least I think so. Provided that the assets we allocate for investment are not needed today and are intended to cover future needs—such as building a hospital, an educational center, helping those most in need, or supporting our children in the future—it is advisable to keep a few key ideas in mind:
- Always think long term.
- Analyze investments carefully or trust an advisor or manager to do so.
- Assume that there will be volatility in the markets.
- Accept that, at times, there will be pain.
This way, you increase the chances that your assets will grow over time, fulfill the purpose for which they were created, and, at a minimum, beat inflation, which does so much damage to savings.
I wish you all a great 2026, even or precisely, in an environment of market volatility.
And, if you’ll allow me, I’d appreciate a prayer for my family during this journey.
Happy 2026.
For previous Market Reviews, click here.