The rises that began last year continued in January, although on this occasion the technology sector did not lead the movement, giving way to other sectors. Is something changing?
Fixed income, meanwhile, is maintaining the momentum we saw last year: short maturities are performing better than long ones. This behavior is significant, as it may be anticipating what is happening, or may happen, in the future.
- S&P 500: +1.37%
- Nasdaq: +1.20%
- Stoxx Europe: +3.18%
- MSCI All Country World Index (EUR): +1.27% (the dollar fell 0.90%, while the index in USD rose 2.83%).
- Global Fixed Income Index (EUR): -0.35% (the dollar fell 0.90%, so the USD index rose 0.11%).
The start of the year didn’t even give us time to settle into our chairs. On January 3, the capture of Nicolás Maduro and his transfer to the United States acted as a real wake-up call for the markets. Beyond the political component, the impact was clearly felt in oil: Brent rose from around $60 per barrel to nearly $70 throughout January, reflecting the increase in geopolitical risk premium in a market already tight in terms of supply.
The so-called “Magnificent 7” rose by only 0.55%, clearly below both the S&P 500 and the Nasdaq. This behavior is relevant because it challenges one of the most repeated narratives of recent years: that a small group of companies can sustain the market indefinitely. January suggests that investors are becoming more selective.
So who has led the gains? To delve a little deeper into the analysis, we take as a reference the US index that groups together the 3,000 companies with the highest market capitalization. The best-performing sectors for the month were energy (+17.63%) and materials (+16.10%), while the last on the list was, surprisingly… TECHNOLOGY!!!, with a drop of -3.87%.
The market is beginning to question the real profitability of the huge investments announced by many companies linked to artificial intelligence. From a prudent perspective, we prefer not to be exposed to this type of gamble. The case of Microsoft was revealing: its share price fell by nearly 10%. The market did not punish the quality of the business, but rather the sharp increase in CAPEX in artificial intelligence. The market is questioning whether it will be profitable.
At the same time, the Bloomberg Commodity Index has risen 8%, while gold has advanced 10% and silver 11%.
Movements in commodities, especially precious metals, are often an early sign of increased uncertainty. When they rise in a coordinated manner, the market is paying a premium for protection… and warning that the year is not going to be exactly boring. The reasons that immediately come to mind are growing tensions between the United States and other countries, Donald Trump’s increasingly harsh foreign policy tone, an energy market that is already tight in terms of supply, and even less common events, such as the renewed geopolitical focus on Greenland. I believe these events may have an influence, but there is a somewhat deeper interpretation that has to do with the US government’s accounts.
As I mentioned earlier, the performance of fixed income provides us with valuable information. Short-term bond yields are falling, largely influenced by central banks’ interest rate management. However, yields on longer maturities, which are more driven by investor supply and demand, remain stable or are even rebounding.
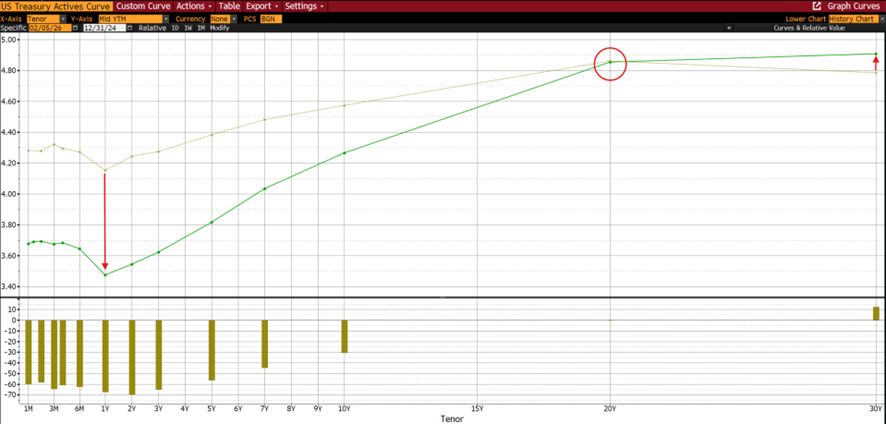
Source: Bloomberg
The brown line represents the yield curve as of December 31, 2024, and the green line represents the yield curve as of February 5, 2026. The red downward arrow indicates the decline in yields on one-year government bonds (-0.67%, from 4.15% to 3.47%). The red circle marks the stability of the 10-year bond, while the upward arrow indicates the increase in the yield on the 30-year bond.
As a result, investors are buying short-term debt and selling very long-term debt. Why[1]? Investors are confident that interest rates will fall in the short term, but are beginning to demand greater compensation for fiscal risk, long-term inflation, and fewer buyers who are insensitive to price.
If we add the evolution of the US deficit to this analysis, the picture becomes clearer. The graph shows the evolution of the US deficit in the 21st century. The trend is clearly upward and, according to official projections by the Congressional Budget Office (CBO), the deficit in 2026 will reach -6%, above the last recorded figure of -5.36%.
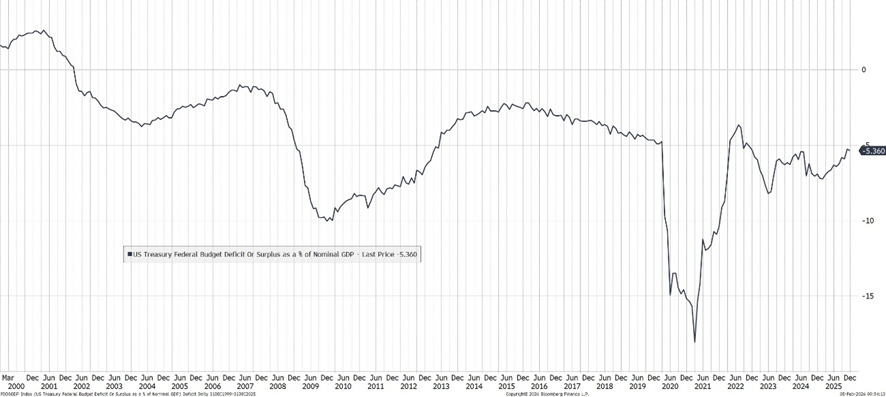
Source: Bloomberg
This implies that public spending structurally exceeds revenue. It should be remembered that during the COVID pandemic, spending increased due to exceptional circumstances, as shown in the graph (dip in 2020). This imbalance must be financed with debt, and this is where a worrying fact arises: US public debt already represents approximately 120% of GDP, meaning that the volume of debt is 1.2 times the country’s production.
The main buyers of US debt have historically been pension funds and insurance companies, both domestic and international, as well as countries such as China and Japan. However, China has reduced its debt purchases and is significantly increasing its gold reserves. This can be interpreted as an attempt to weaken the role of the dollar as the world’s reserve currency and, at the same time, to gradually replace the dollar with gold on its balance sheets.
The big question is: who is replacing these purchases of US debt? The Federal Reserve? For how long? We don’t know. This helps explain why US government bond yields have not fallen and have even risen in the longer maturities: there are fewer and fewer structural buyers, and not just China. What is the result? Just look at these two charts: gold and the dollar against the euro.
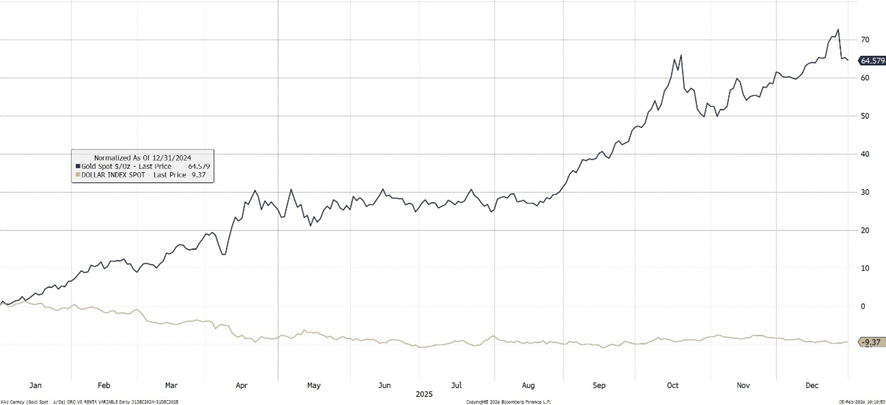
Source: Bloomberg
Gold has risen 64%, while the dollar, against a basket of international currencies, has fallen 9%.
And this is not just a problem for the United States. This image shows public spending as a percentage of GDP around the world. Dark brown represents countries with public spending above 40%, lighter brown between 30% and 40%. Most of Europe spends more than 40% and the United States more than 30% and rising. At the beginning of the 20th century, it was between 0% and 10%.
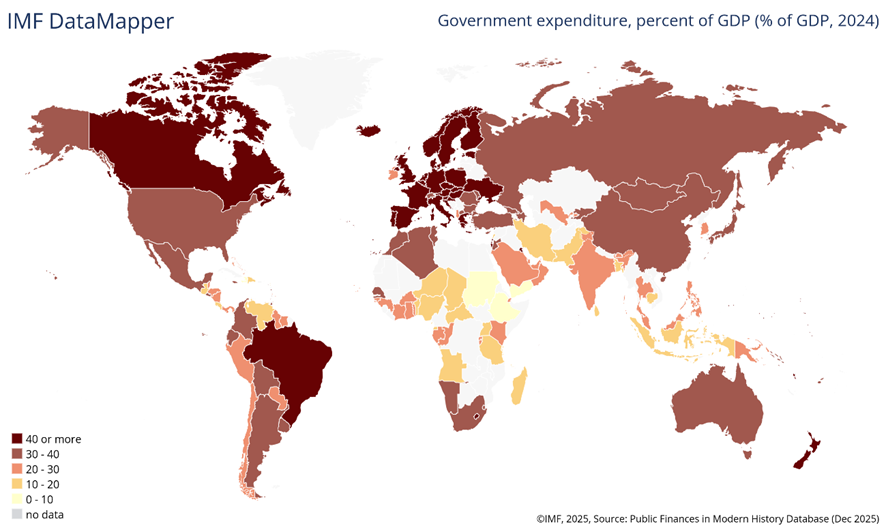
Source: IMF
I have nothing against public spending as long as it makes sense, but these levels imply high taxes and increased debt. Does it make sense? Well, that’s what investors are worried about.
What does all this smell like? Growing uncertainty about the US public accounts, where debt interest payments already exceed defense spending. As a result, there is a gradual loss of confidence in the dollar.
This brings us back to the world of commodities, and in particular precious metals such as gold and silver. Why are they rising so sharply? For me, there are two fundamental reasons:
- Less supply and the same or growing demand.
- Since the commodities crisis caused by overcapacity generated as a result of the Chinese supercycle, many of these companies have canceled projects.
- Environmental regulations that impose many obstacles to production.
Silver, for example, is used in various industries such as electronics, solar energy, automotive, and jewelry, so demand remains strong.
- Protection. We have seen that one of the uncertainties is future inflation.
- We have already seen that raw materials have begun to rise sharply, and if I had to bet, this will continue in the near future.
- The growing deficit is inflationary if there is full employment. The unemployment rate in the United States is 4.4%, which implies full employment.
With regard to gold, there has been a significant increase in purchases by central banks globally. According to a survey by the World Gold Council, 95% of central banks expect to increase their gold reserves over the next twelve months. This trend invites reflection: what are the major institutional players anticipating?
This behavior fits with a macroeconomic scenario such as the one described above. In this context, it is reasonable to consider whether it is advisable to seek protection against inflation. In our opinion, the answer is yes, provided that a prudent and diversified approach is taken.
There are different ways to gain exposure to this type of protection: direct investment in gold, silver, or other commodities, as well as investment in companies linked to these sectors. However, it is important to note that not all of these companies behave in the same way.
For example, gold producers tend to benefit from rises in the price of the metal, as a significant portion of their costs are fixed, which generates an operating leverage effect and increased margins. On the other hand, developers do not yet produce gold, but they have identified deposits and are working to bring them into production; these are companies with greater volatility, but also with high potential for appreciation. Finally, royalty companies provide financing for mining projects in exchange for a contractual right to a portion of the economic value of production, allowing them to operate with very low costs and structurally high margins.
Beyond raw materials, investing in companies with real assets is also an effective tool for protecting against inflation. Keeping capital tied up in an inflationary environment implies a progressive loss of purchasing power, commonly known as the “invisible tax” on savings.
Therefore, investing prudently and in a well-diversified manner is not a matter of opportunity, but of preserving wealth. If the goal is to maintain the same consumption capacity in the future as today, postponing investment has a cost. In this sense, tomorrow may be too late to start investing.
[1] Remember that bond prices move inversely to interest rates.